
Last year, Facebook reported 2.6 billion monthly active users and generated $84.2 billion1 in ad revenue. So as a marketer, you can't really afford to ignore Facebook ads. But there are also good reasons why many businesses have stopped running Facebook ads.
You have to factor in the Facebook ads cost of lead qualification as well, and then it becomes much more expensive than the average cost per lead (CPC) that Facebook offers.
Is it any different with paid search ads? According to WordStream (which manages $14 billion in Google Adwords budgets), the key difference is that Adwords helps you find your customers, while Facebook Ads help your customers find you.
What does this mean, exactly? Google allows you to tweak your ads until you find the right high-volume, low-competition keywords (eg: science coaching class) that produce quality leads at a reasonable CPC.
On the other hand, Facebook makes it very easy for people to provide their contact information to you. A Facebook Lead Ads form is pre-filled with lead data - name, number and email. So all they have to do is click on the ad and then one more click to send you the form data.
This makes it easier to generate more leads on Facebook than on Adwords. It also means the number of junk leads you get increases the real cost of buying leads.
Automate lead qualification for digital leads from Facebook. Filter out junk leads.
Dial only real prospects. Experience the power of Lucep:
So this is the problem of plenty that we’re going to address in this article - the real cost of buying leads on Facebook. We’ll consider both, starting with Facebook’s cost per lead categorised by industry, and then add in the other costs to figure out what is the overall cost of customer acquisition on Facebook.
Facebook ads cost per lead.
Cost per click (CPC): The average Facebook ads cost per click across all industries is $1.72. For automotive, the CPC is $2.24. For real estate, it is $1.81. For education, it is $1.06. For Finance & Insurance, it is $3.77.
Conversion rate (CVR): The average conversion rate of Facebook ads, across all industries, is 9.21%. For automotive, the CVR is 5.11%. For real estate, it is 10.68%. For education, it is 13.58%. For Finance & Insurance, it is 9.09%.
Cost per action (CPA): The average cost per action on Facebook ads, across all industries, is $18.68. For automotive, the CPA is $43.84. For real estate, it is $16.92. For education, it is $7.85. For Finance & Insurance, it is $41.43.
Source: Wordstream2
So if, for example, you’re an edtech or educational institution advertising on Facebook, the numbers (CPC of $1.06, conversion rate of 13.58%, and cost per action of $7.85) seem to offer better returns at a lower cost than other industries, especially when you consider the lifetime value of each student continuing to pay their tuition fees year after year.
Lead generation cost per lead.
But the Facebook ads cost is only the tip of a marketing and pre-sales iceberg. The real cost of buying leads happens before and after that. The average cost per lead for the education industry is $553 (source:Marketingcharts), which factors in agencies, martech, labor and media.
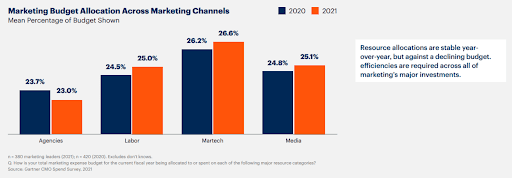
As per the latest Gartner CMO Spend Survey, investments in pure-play digital channels are dominating their priorities, accounting for 72.2%4 of the total marketing budget.
This is the budget allocation across the major marketing resource areas of agencies, martech, labor and media.
Out of the 72.2% of their marketing budget that businesses are now allocating for pure-play digital investments, social accounts for 11.3%. The report notes that declining budgets require you to find efficiencies across all of these major marketing investments.
Pre-sales costs of lead qualification.
It is easier to reduce the customer acquisition costs, if you look for efficiencies in the lead qualification process after you get a sheet of raw numbers from Facebook.
Form fills from your website, social media or other digital sources rarely respond to the call centre, pre-sales or sales team’s first outreach attempt. At least 6-8 follow-ups are required across channels (phone, SMS, Whatsapp and email) to qualify a lead and convert it into a conversation and follow-ups with your top sales people.
If you’re generating 10,000 digital leads a month for one project - is your call centre - including business development and pre-sales teams, able to make 20,000+ calls and another 20,000 emails and messages, to just validate and qualify these leads?
Call centre costs calculator
What is the cost per lead associated with this lead qualification process? Here’s an example, taking 5,000 leads per month as an input for the calculation of call centre, Telco and Whatsapp costs (may vary by country) for making phone calls, and sending SMS and Whatsapp messages.
| Number of leads per month | 5000 |
| Number of attempts required | 3 |
| Average handling time (mins) | 0.75 |
| Cost per call per min | 0.45 |
| Cost per SMS | 0.13 |
| Cost per WhatsApp | 0.65 |
| Cost per call centre resource | 20000 |
| Average working hours per resource | 8 |
| Overhead cost per call centre seat | 5000 |
| Est. total number of dials required | 10000 |
| Est. dialling hours per month | 125.00 |
| Resources required for the month | 0.78 |
| Total cost for call centre staff per month | 25000 |
| Total telco cost (voice + sms) | 4675 |
| Total cost (without WhatsApp) | 2967 |
| Cost per lead (without WhatsApp) | 5.94 |
| Total WhatsApp cost | 650 |
| Total cost (with WhatsApp) | 3617 |
| Cost per lead (with WhatsApp) | 7.24 |
If you’d like to run this for yourself, download our Call centre costs calculator. Just input the number of leads, and change the costs and other inputs (if needed) to get the total cost per lead for these pre-sales lead qualification activities.
Add up the Facebook ad costs per lead to the lead generation and other marketing costs, and then the pre-sales lead qualification costs. This is your real cost of buying leads, which can then be distributed to the sales team.
References:
1. Facebook full year financial results
2. Facebook Ad Benchmarks for YOUR Industry
3. Projected 2022 Average Cost Per Lead By Industry And Channel